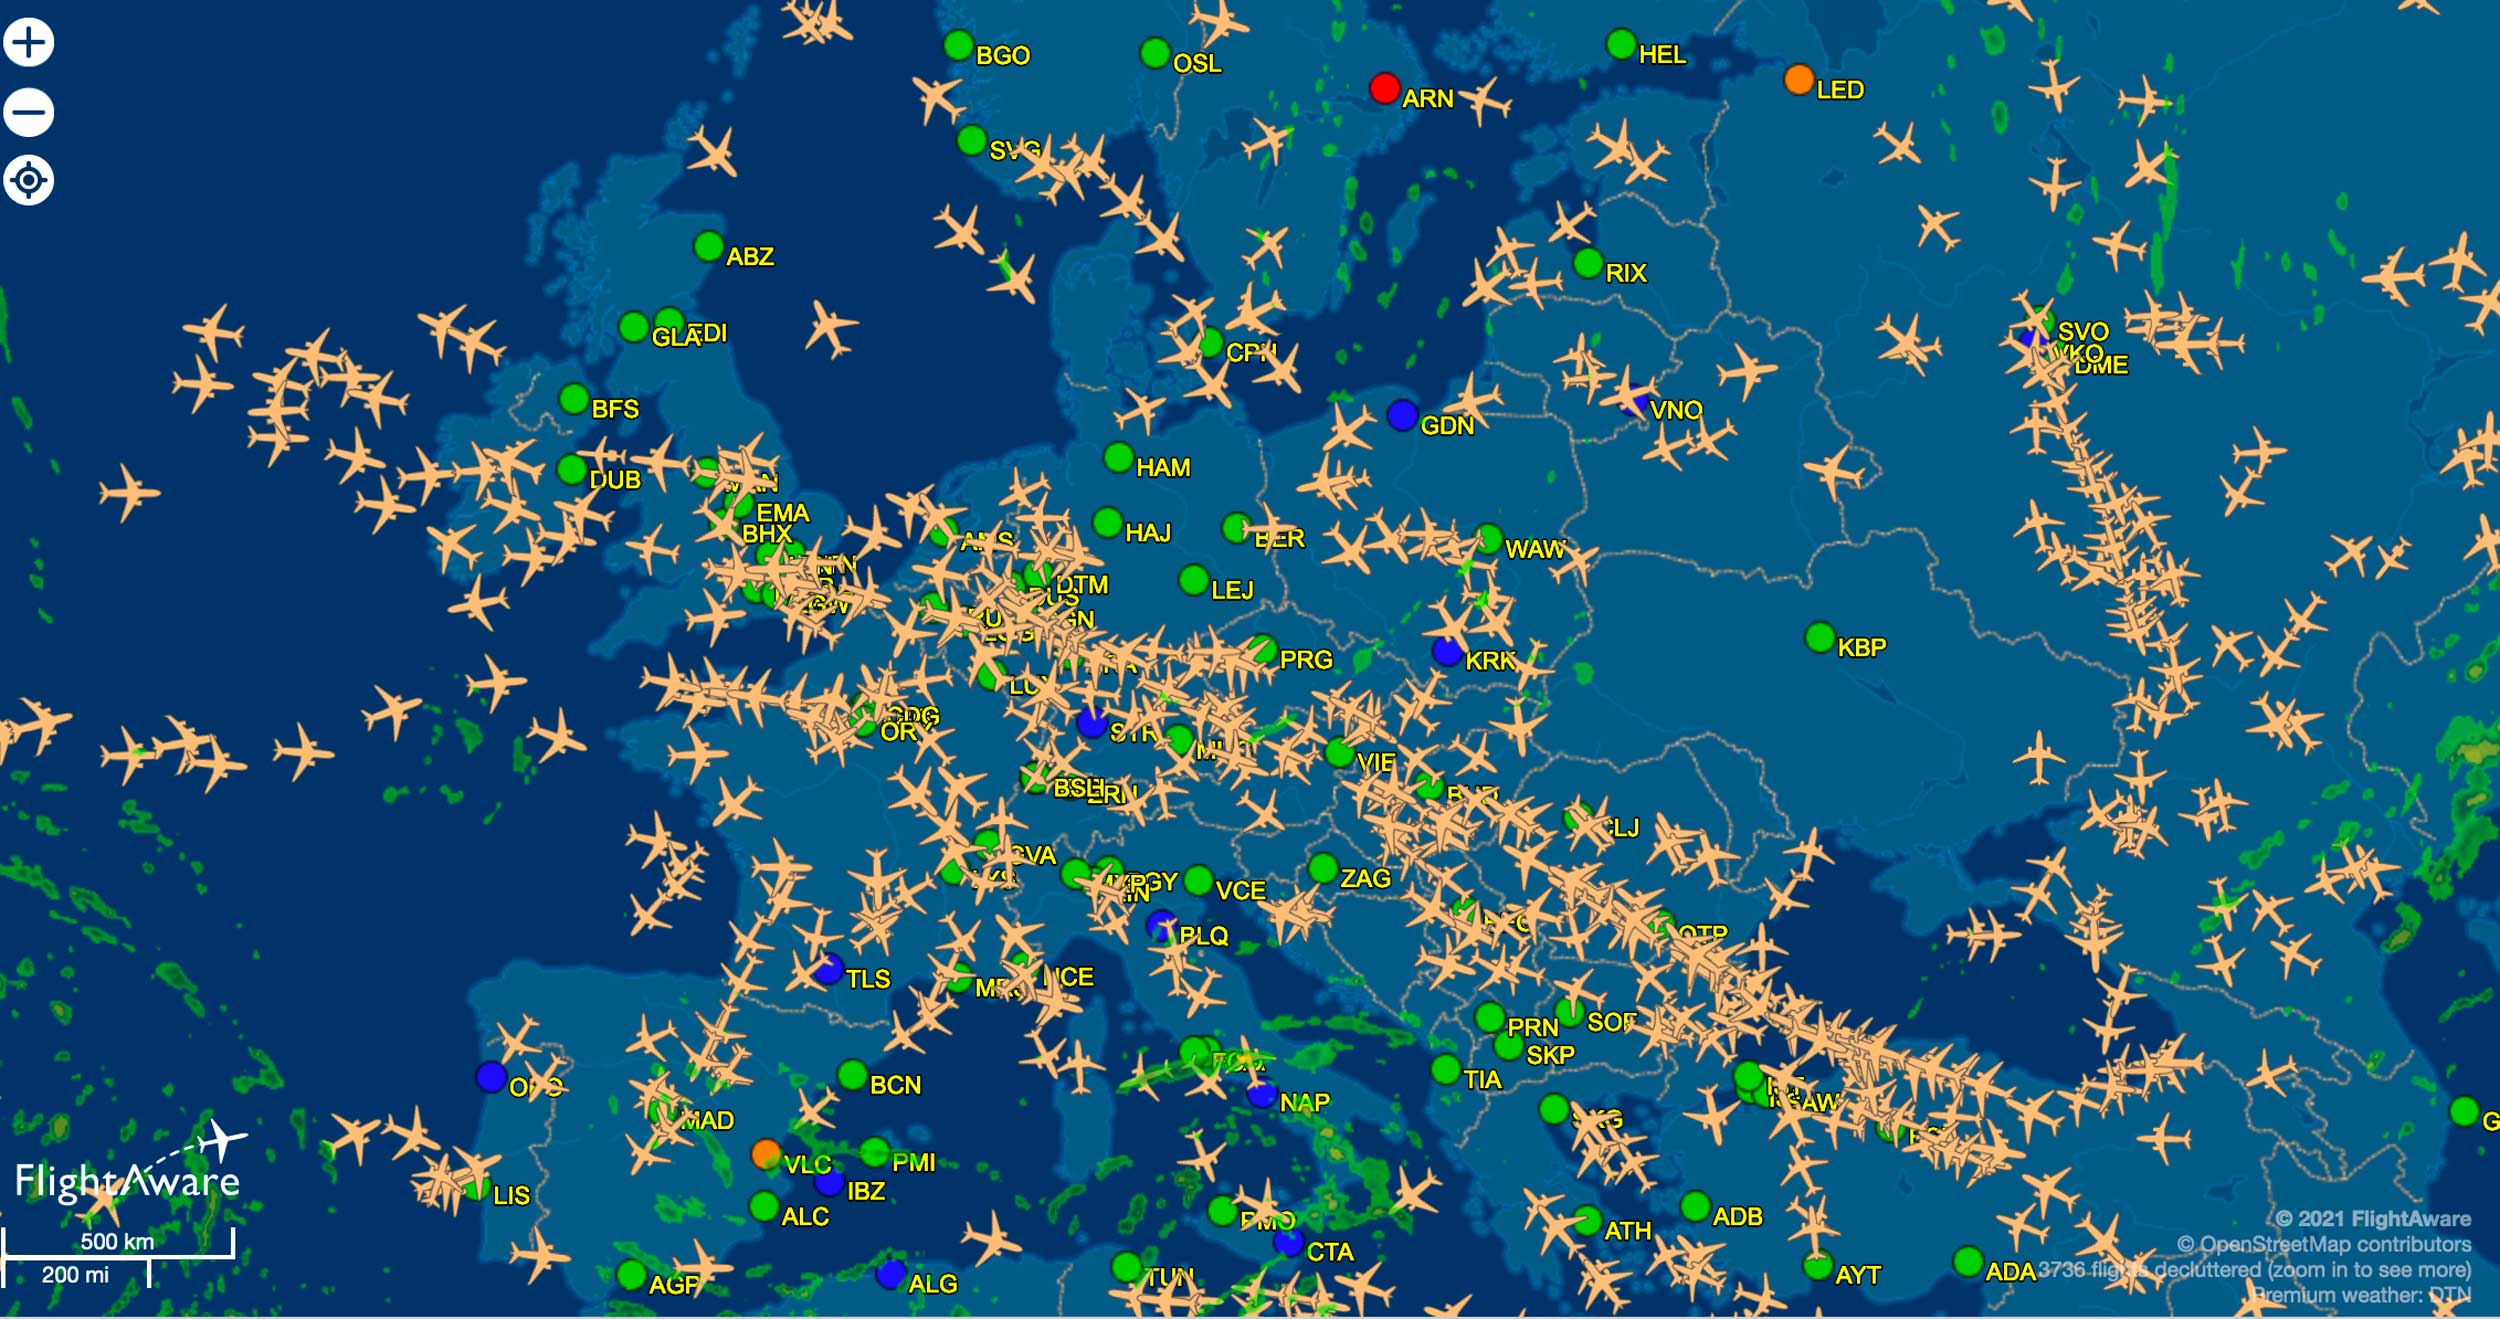
 Recovery of aviation following the Covid-19 pandemic is mixed around the world, according to flight tracking website Flightaware. China, where it all started, is now just 2% away from full recovery, said Daniel Baker, CEO of Flightaware.
Flightaware’s detailed report looks at the impact of the global pandemic on the aviation industry, how it began, and where we are today.
Key takeaways:
- Commercial passenger airlines have levelled off at a modest 50% recovery of traffic levels in late 2020 and early 2021 relative to 2019. However, that recovery profile is very diverse geographically, with some very slow, some double dips, as well as some very strong regions.
- Other operation types outside of commercial airlines, including both business aviation and cargo, have seen a more substantial recovery and even growth throughout the pandemic.
- There have been different recovery profiles for flights above and below four hours. Flights under four hours have recovered a bit more strongly, whereas flights over four hours, and long haul flights, have had a weaker recovery due to immigration and border restrictions.
- There have been multiple changes to the mix of aircraft size impacting airport planning for how many widebody gates and narrowbody gates they have available.
The Big Picture
All charts and images: Flightaware
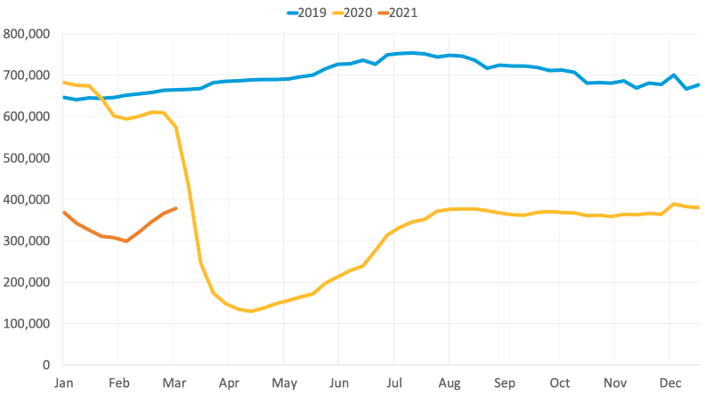
In 2019, we see the typical variation between summer and winter flight volume, about 10%. Looking at 2020, starting in late January and into February we can see an initial drop due to flight volume in China rapidly decreasing.
Then in March, there was a global drop in every region of the world, bottoming out sometime around mid-April in terms of flight volume.
In spring and into summertime, flight volume started a slow recovery, which then roughly flatlines from August until the end of 2020.
The early part of 2021 actually saw some additional decrease with lockdowns in various parts of the world.
While the above graph gives us a general idea of what the aviation industry experienced, the impact around the world has been non-uniform.
Recovery by Geographic Region

Above, the graphs are split into six different regions where Flightaware has tracked commercial passenger flight activity (again with 2019 in blue, 2020 in gold, and 2021 in orange).
North America most closely resembles the global average graph, with the drop, the somewhat U-shaped recovery, and then flight volume flatlining ever since late summer in the Northern Hemisphere.
South America has been a very different story. It was up year-over-year at the start of 2020, but then had a much larger drop than North America, and the recovery has been much slower. This is due to flight traffic in Brazil being hit particularly hard, as well as a large number of countries in the region with varying lockdown and immigration restrictions. After the initial descent, flight volume peaked around the holidays in late 2020 but has now slid another 10% since the beginning of the year.
Europe is unique in that it’s the only region where we’ve seen a double-dip. It had a U-shaped recovery similar to North America, but European flight schedules are typically much heavier in the summer than they are in the winter, and that weakness in the winter months showed again at the end of 2020 and into 2021, where it’s well below its summer peak.
The Middle East is very dependent on connecting traffic, similar to South America. It recovered slowly but steadily throughout 2020, but has flatlined since the end of last year.
Asia as a whole has two different stories to discuss (note that Flightaware broke out China separately from the total Asian numbers here). There’s an early drop due to the initial advent of the pandemic in China, and then the extended dip as the rest of Asia started closing borders.
The recovery got up to around 50% to 60% of flight volume in Asia as a whole throughout the year 2020, and then in early 2021, we see another dip, before traffic starts to pick back up.
In China, you can see the dip came much sooner and it was generally deeper, however, the recovery has also been much stronger. From about October onward, China was back to 85% of 2019 flight volume, while the rest of Asia remained substantially depressed due to the large number of border closures and immigration restrictions.
Recovery by Operation Type
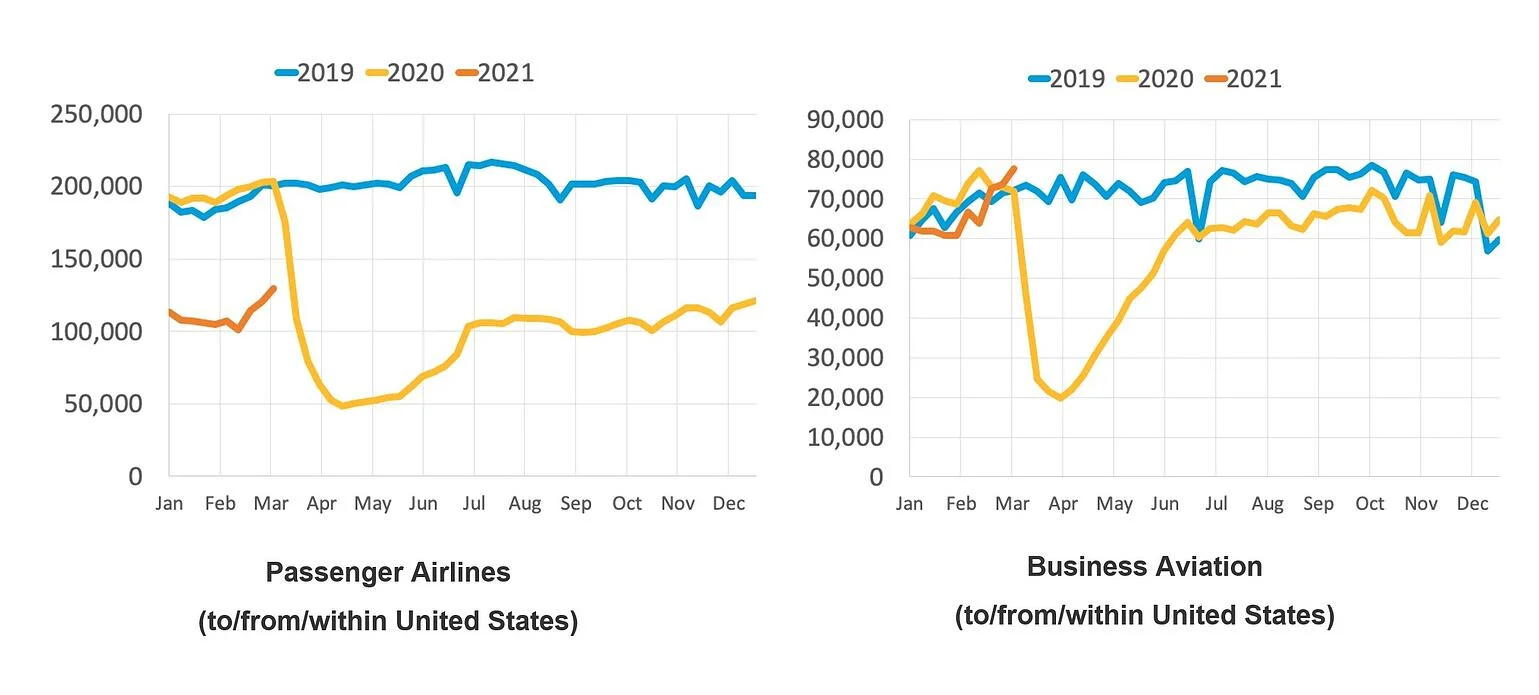
Looking at different operation types, there are very different stories. On the left, you can see passenger airline flights to/from/within the United States, which is roughly in line with the global and North America numbers on the graphs mentioned earlier. The most notable difference is that there has been a fair bit of recovery towards the end of February and into March of 2021.
On the right side, we have business aviation (jet-powered turboprops and business jets being used for private aviation) where the recovery in 2020 was much more V-shaped, rather than that extended U-shape we saw on the commercial airline side.
Business aviation flight volume had a much stronger recovery. It moved from the 85% to 90% range from late summer of 2020, and in 2021 has outgrown even the peaks of both prior years.
However, we’ve seen some shifts within business aviation. Since COVID began, fewer corporate in-house flight departments are operating and there has been more of a shift to charter, as business meetings are still relatively light and there’s a lack of need for business travel, particularly with the closed borders and general concerns about spreading the disease.
Meanwhile, some marginal passengers who are families who would have otherwise booked a first-class airline airfare, are now moving up into the low end of a business aviation charter.
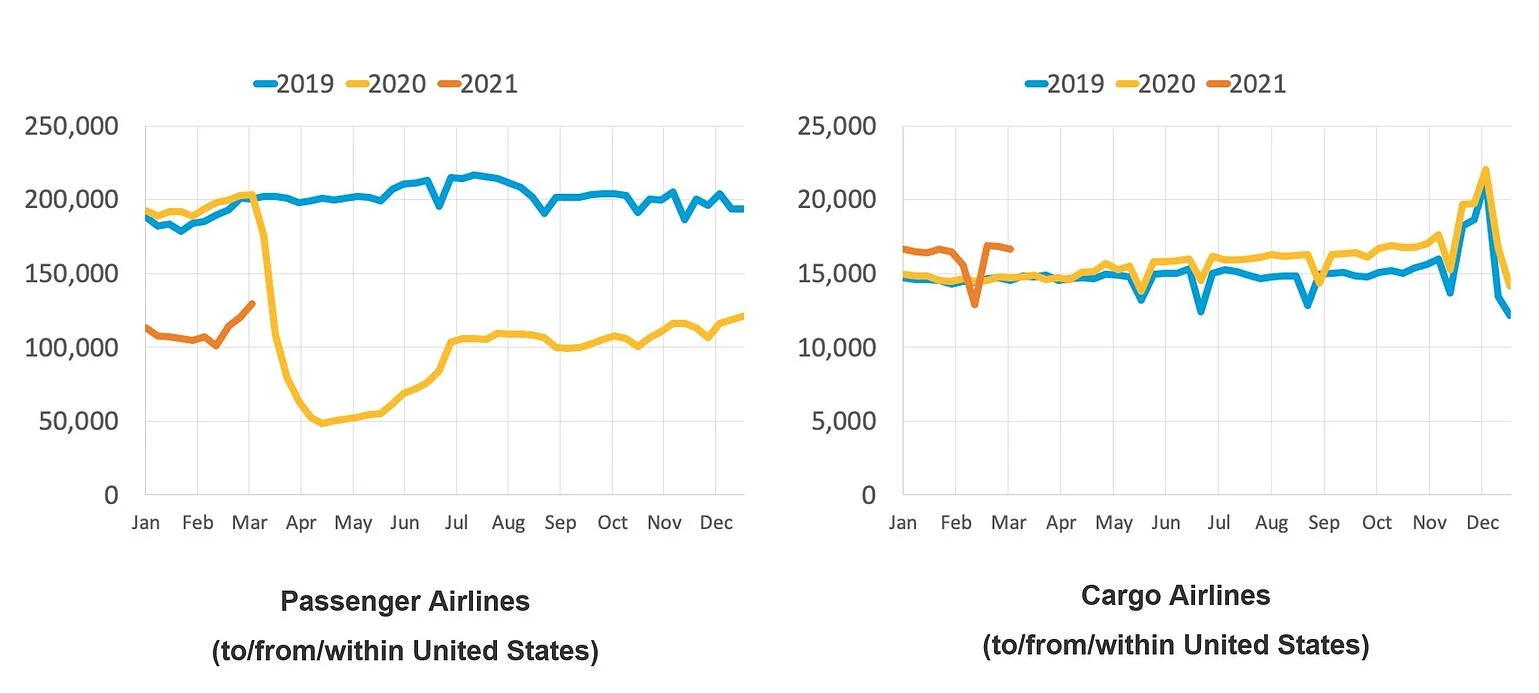
Similarly, we’ve seen a very different traffic trend for cargo here on the right, to/from/within the United States, which saw no dip at all. The growth actually continued throughout the rest of 2020, even after the onset of COVID, due to the expansion of e-commerce, online shopping, and particularly Amazon’s own aircraft operations.
In 2021, cargo continued from where it was prior to the holiday season, showing a slight dip most likely associated with the severe winter weather that affected Texas and much of the nation in February.
Recovery by Flight Length
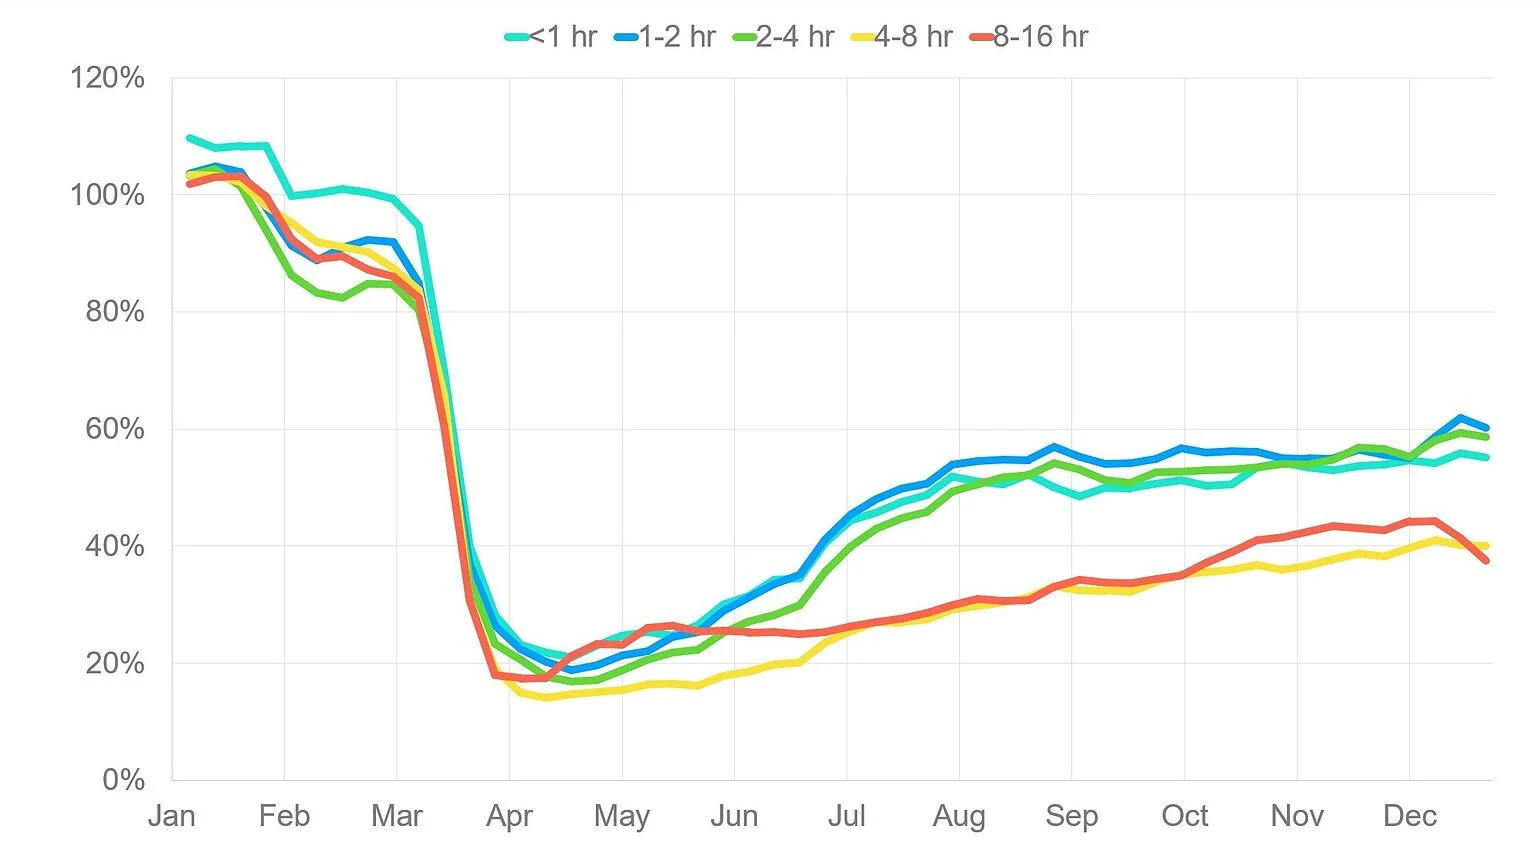
Another way we can look at the data is by the length of commercial flights. When comparing 2020 to 2019, the year started with slight growth in all segments and some stronger growth (about 10%) for flights that lasted under one hour.
The dip in February and into March 2020 is due to flight volume dropping in China, followed by all stage lengths of flights dropping together in March as the world shut down due to the pandemic.
After the initial drop, we’ve seen a couple of places where growth based on stage length has really differentiated itself. There’s a bump in late April and into May 2020 for the long-haul flights of 8 to 16 hours. This was driven by the hot cargo market at that time, which led to passenger airlines starting “all cargo” services, particularly between the US, Europe, and China, to make up for the lack of belly cargo availability.
Beginning mid-to-late summer of 2020 we see the bifurcation of flights under 4 hours, which have had a more robust recovery. These are now around 60% of where they were previously, while flights of 4 or more hours have had a weaker recovery largely due to closed borders and other immigration restrictions.
Recovery by Airliner Size
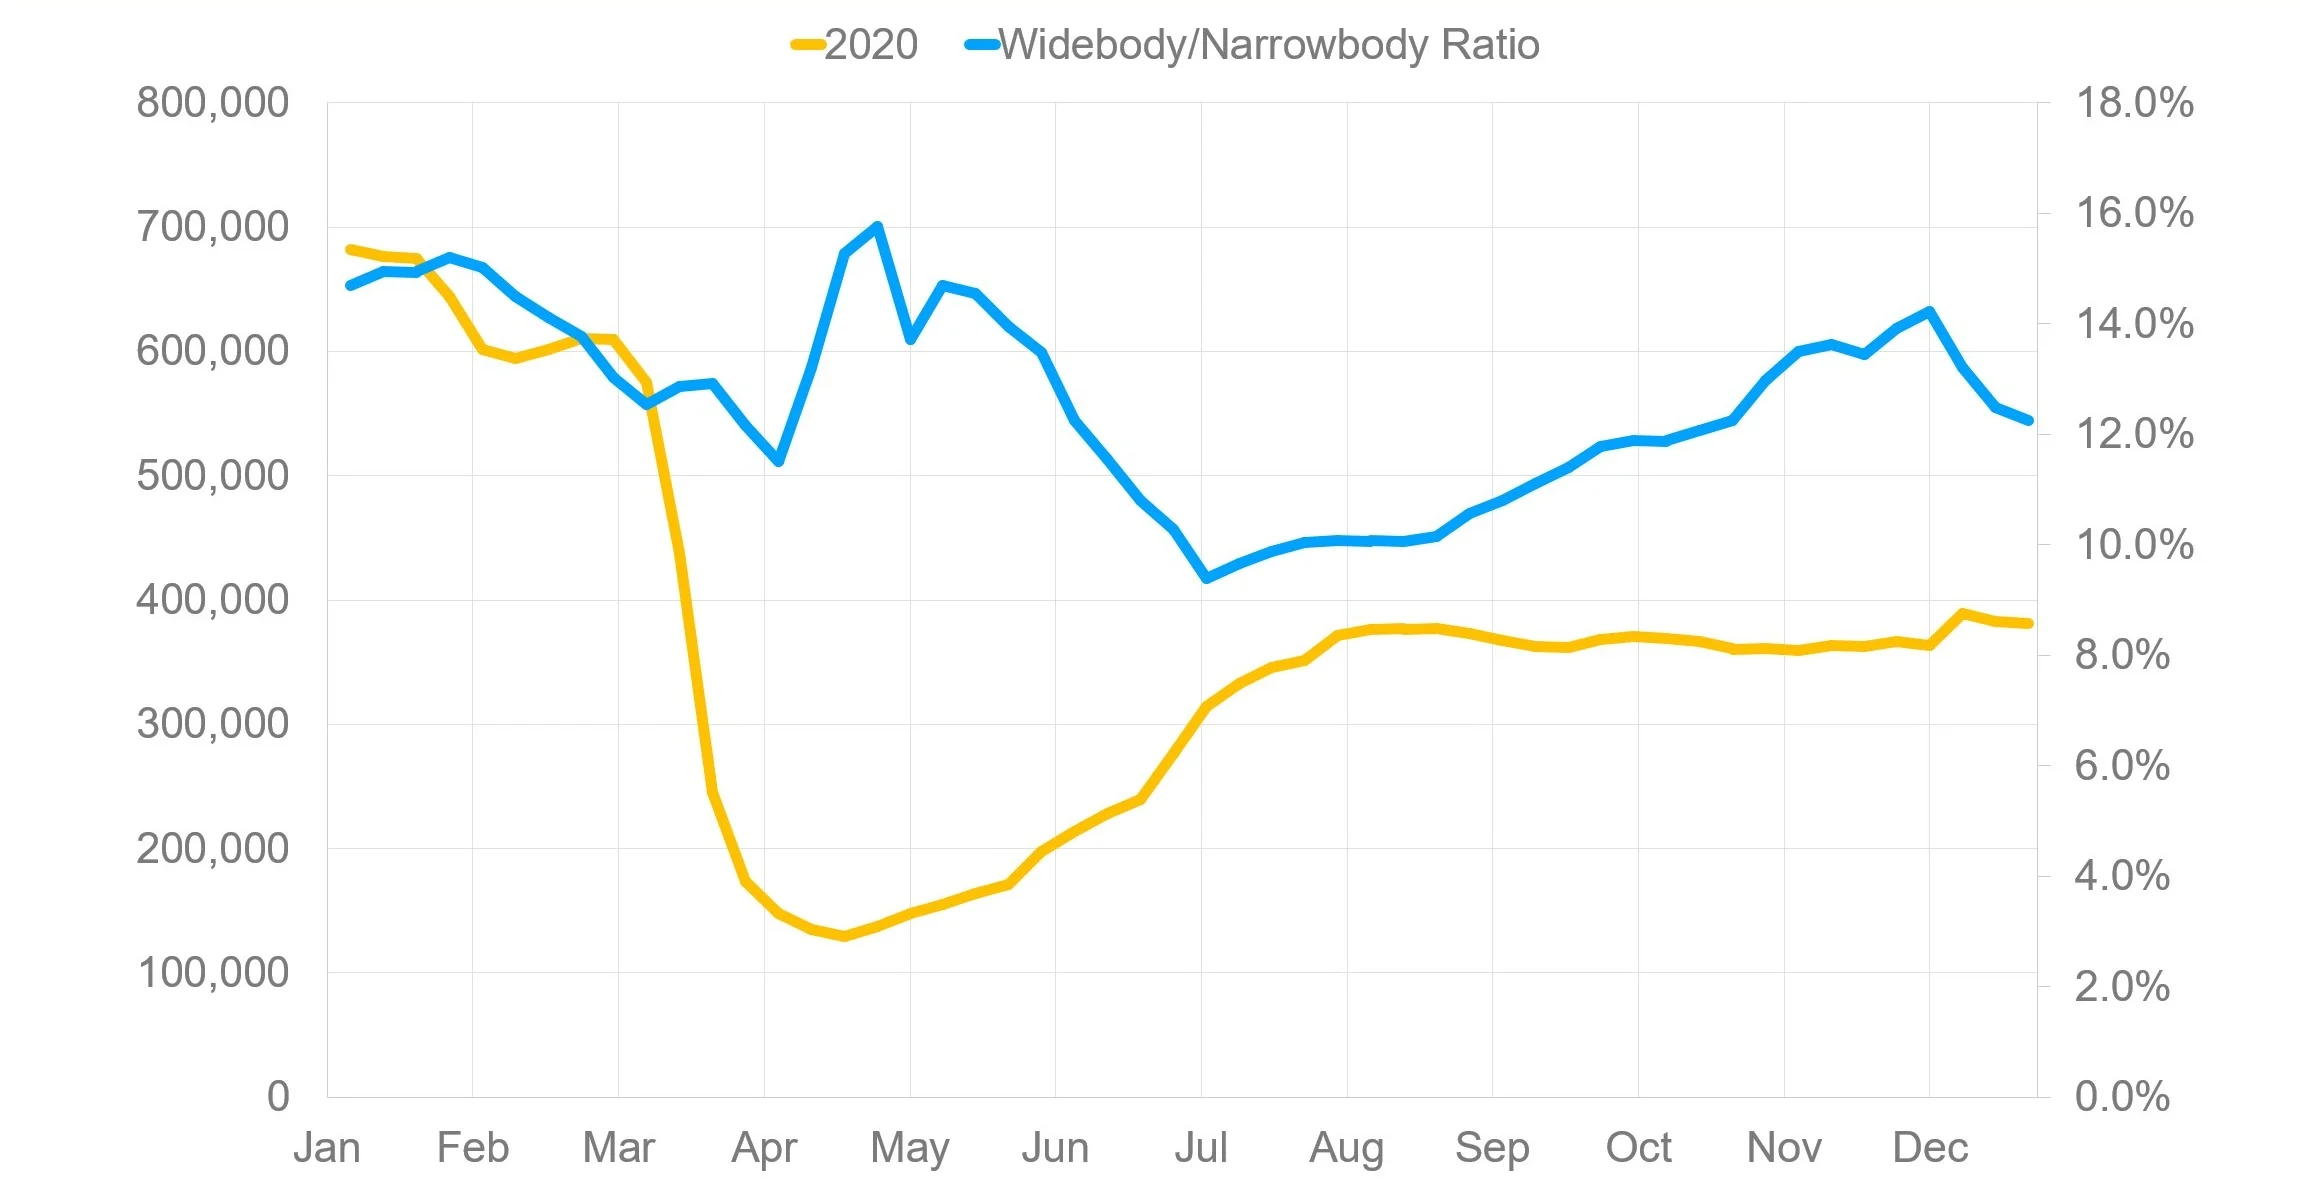
The last area we reviewed is the mix of different aircraft size. Shown above in gold is the 2020 flight volume for commercial passenger airlines and in blue, on the right-hand scale, is the percentage of widebodies as a fraction of the number of narrowbodies operating.
Here again, we see that the widebodies were hit harder by the flying reductions in February and March, but then experienced a resurgence in late April and May due to the long haul widebody flying of passenger aircraft, carrying only cargo.
Since then the widebodies experienced both a dip and then a recovery. It remains to be seen where we end up in terms of the mix and the recovery of long haul flying, which is typically done with widebodies versus short-haul flying done with narrowbodies.
